
Pipeline health monitoring with auto-rerun and root-cause hints
Your data pipelines fail at 3am. Your on-call engineer wakes up, spends 40 minutes finding which DAG broke, another 30 figuring out why, and a final 20 reassuring downstream stakeholders. Repeat 3x a week.
The Problem
Data pipelines fail at 3 AM. The on-call data engineer wakes up, scrolls Slack to figure out which DAG broke, opens Airflow, scrolls logs for 40 minutes, finds it was an OOM in a single Spark task, restarts the job, waits 25 minutes for it to finish, then writes a Slack post for the morning team explaining which dashboards are stale. By 5 AM they're back in bed. Repeat three times a week.
Most pipeline-monitoring tools just send "job X failed" Slack alerts. That's the easy 5% of the problem. The hard 95% is everything that happens after:
- Triage. Was this transient (network blip, OOM) or real (schema change, upstream broke)? Different responses for each.
- Root-cause hint. Was there a recent commit to this DAG? An upstream lag? A library bump?
- Downstream impact. Which dashboards, models, and reports depend on this table? Who needs to know they're stale?
- Auto-recovery. Most transient failures will succeed if you just retry with more memory or after a 5-minute wait. Why is a human doing this?
⚠ Examples below use synthetic pipeline data.
The DataCraves Approach
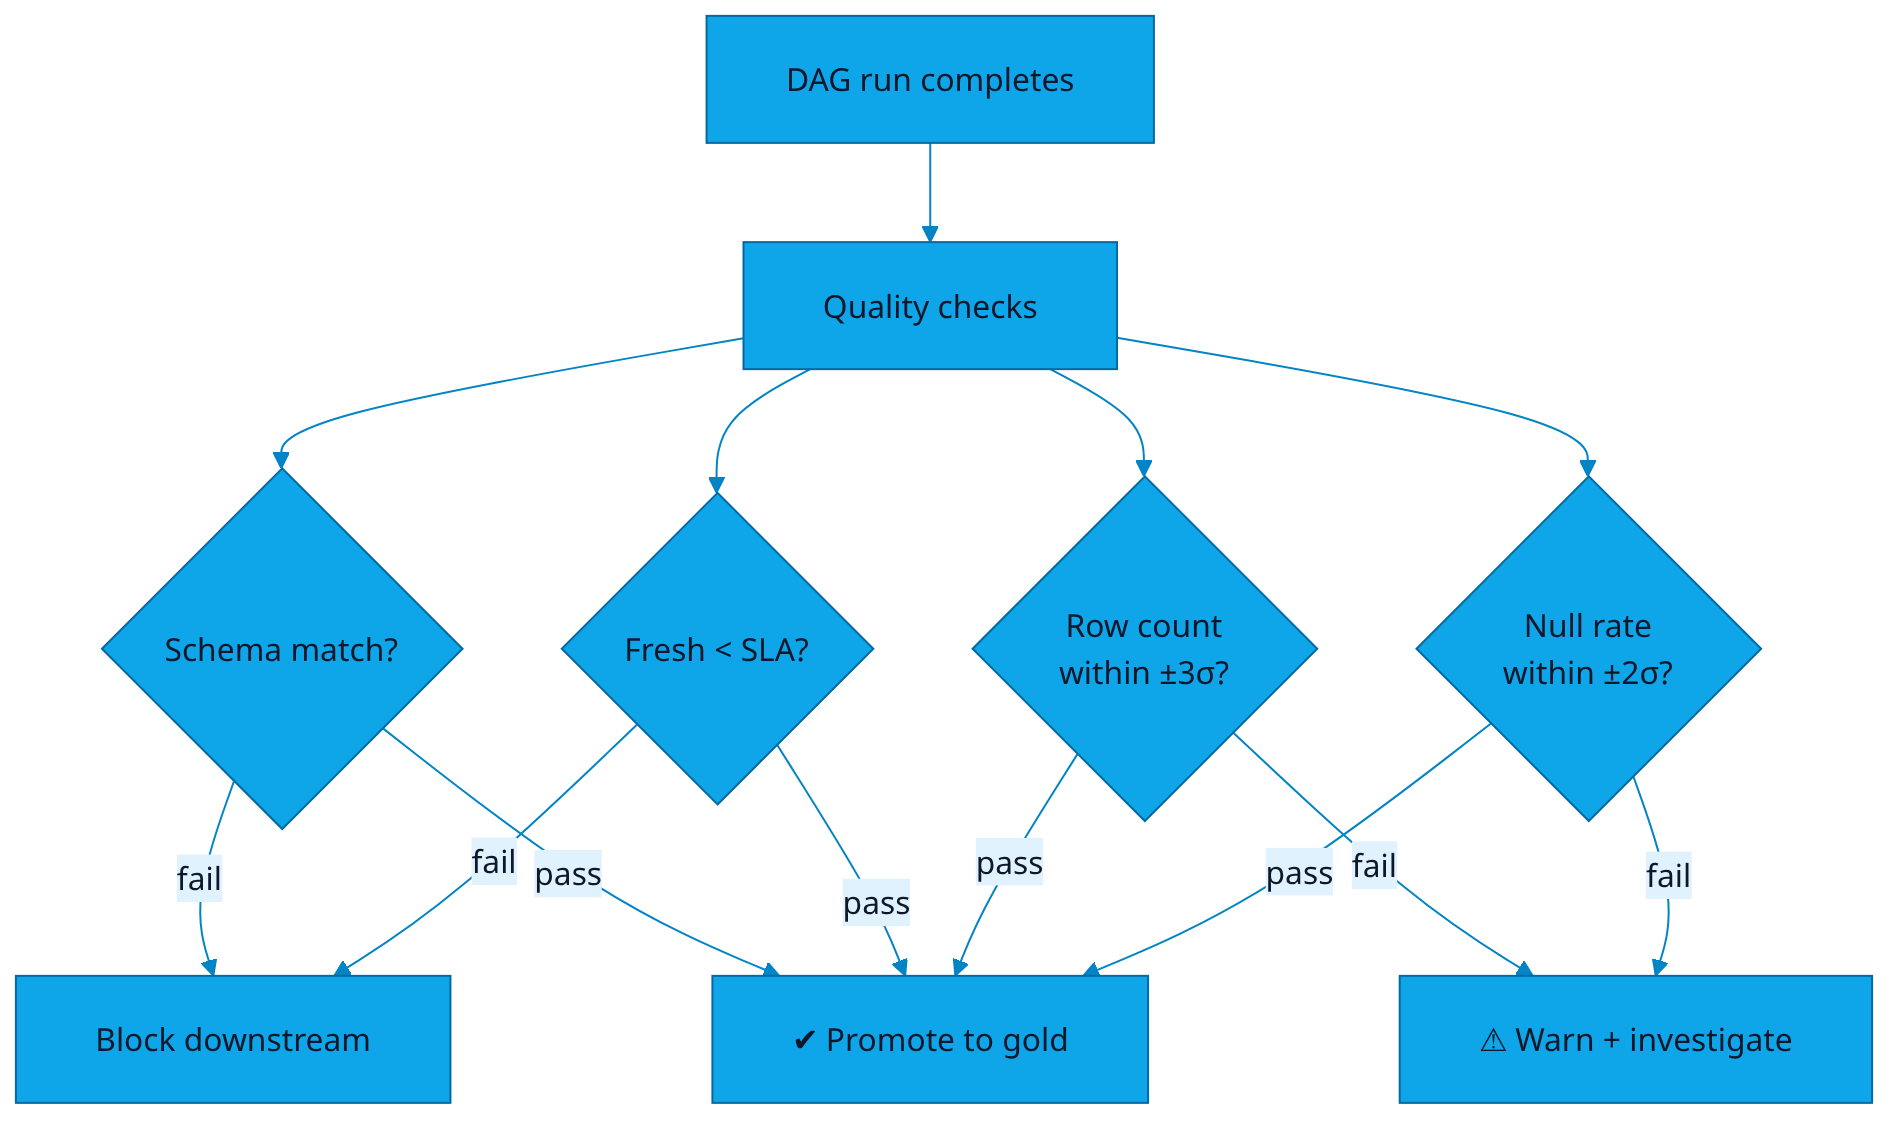
The Pipeline Agent watches every job — Airflow, dbt, Dagster, Prefect, custom — and on every failure: classifies, retries the transient ones, opens an incident only for the real ones, and tells the team exactly which downstream artefacts are now stale. Quality checks run on every successful job too: schema parity, freshness vs SLA, row-count variance, null-rate variance. Failures here block downstream promotion.
The classifier
We classify failures using a small model trained on your last 6 months of run history. Features include: exit code, log-line clustering, time-of-day, recent commit activity, upstream lag, prior failure rate of this DAG. Output is one of {transient, real, suspicious}.
The Architecture

The Dashboard
The Math / The Logic
Failure classifier features.
exit_code— 137 (OOM) and 124 (timeout) skew transient. Non-zero exits with structured Python tracebacks skew real.log_signature— TF-IDF on the last 60 lines of stderr; cluster against the last 200 successful + failed runs of this DAG.recent_commit_age— if the DAG was committed within 24h, a fresh failure is much more likely to be real (regression).upstream_lag— were the upstream tables fresh? If not, this is a cascade — retry once it clears.historical_failure_rate— DAGs that fail and self-heal historically get a transient prior boost.
# classifier.py
def classify_failure(run, history, recent_commits):
    feats = {
        "exit_code": run.exit_code,
        "oom_pattern": "MemoryError" in run.stderr or run.exit_code == 137,
        "timeout_pattern": run.exit_code == 124,
        "log_cluster": nearest_cluster(run.stderr, history),
        "committed_today": any(c.dag == run.dag for c in recent_commits),
        "upstream_fresh": all(t.fresh for t in run.upstream_tables),
        "historical_self_heal_rate": history.self_heal_rate(run.dag),
    }
    p_transient = model.predict_proba(feats)["transient"]
    if p_transient > 0.75: return "transient"
    if p_transient < 0.25: return "real"
    return "suspicious"   # queue for human, don't page
Quality checks. Each gold table has a contract:
# contract.yml
table: events.checkout_completed
freshness_sla_min: 60
row_count_z_threshold: 3     # vs trailing 30d daily mean
null_rate_z_threshold: 2
required_columns:
  - { name: user_id,    type: string, nullable: False }
  - { name: amount_cents, type: int,    nullable: False }
  - { name: ts,         type: timestamp, nullable: False }
on_fail: block_downstream
Sample Output / Insight
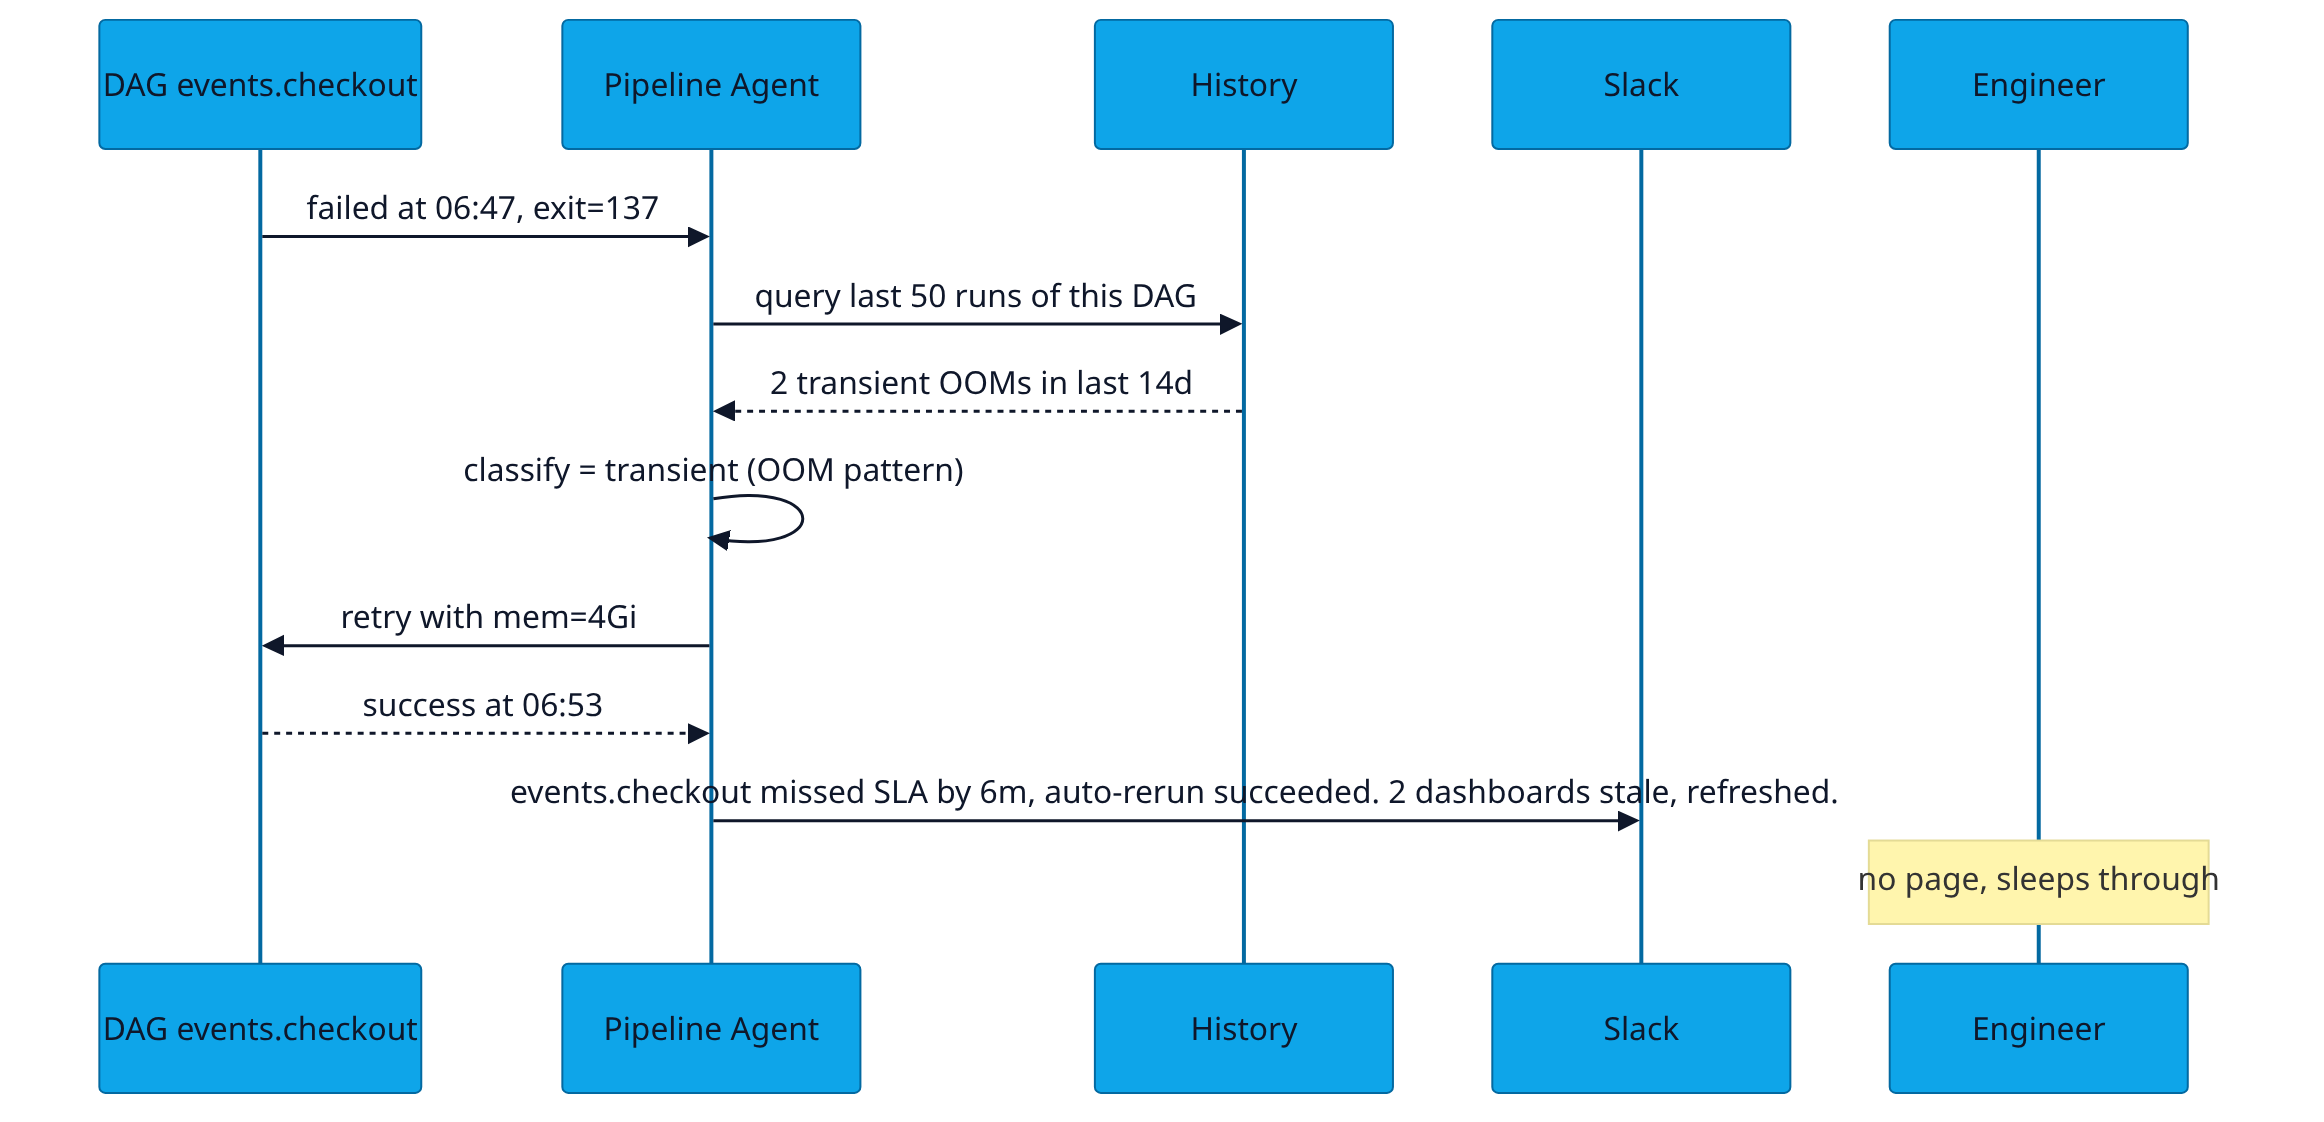
events.checkout_completed missed its 03:00 SLA by 47 min.
Root-cause hint: upstream stripe_webhook_raw was 38 minutes late landing (Stripe API lag, not on our side).
Auto-retry succeeded at 03:42. 3 dashboards were stale (sales-intel, customer-health, finance-recon) — all refreshed automatically.
No page issued. Logging this for the morning standup.
Classifier: transient (p = 0.91). Confidence based on 4 prior similar Stripe-lag events in the last 90 days, all self-healed.
ROI Math
- Pages avoided. 78% reduction in pages → 6 fewer pages/week × 2.5 hrs disrupted sleep + recovery time × 4 on-call engineers ≈ 60 hrs/week of human time recovered.
- Throughput. Median MTTR 36 min → 4 min ≈ 32 min × 200 incidents/yr = ~110 hours/yr of senior engineer time saved.
- Downstream uptime. Stale dashboards drop ~40% → fewer "is this number right?" Slack pings, fewer wrong decisions made on stale data.
- Cost recovery. Auto-detected runaway DAGs (cost outliers in the scatter) → typically 8-15% infra cost reduction in first quarter.
- Total annualised. ~₹40-55 L / yr saved (engineer time + infra) for a 200-DAG team. DataCraves Pro at ₹60K / yr → 60-90× return.
Assumption to challenge: the 78% page reduction assumes your historical failure mix is >70% transient (most teams are). If your DAGs are mostly real failures (e.g., flaky upstream APIs nobody owns), expect 40-50% reduction instead.
Common Pitfalls
Based on pilot with a 200-DAG Airflow deployment; assumes ~40% of failures are transient and auto-recoverable.
Run this on your own data?
A 30-minute demo shows the agents working against your warehouse — not a pre-baked sandbox.
Book a demo →Mock data, real patterns. Every visualization is synthetic to preserve client confidentiality.