
Auto-generated weekly campaign performance reports
Your marketing team spends 6+ hours every Monday assembling the weekly performance deck. By the time it's ready, half the insights are stale and nobody on the exec team reads past slide three.
The Problem
Every Monday at 9 AM somewhere in the world, a marketing analyst is rebuilding the same deck. Pull last week's spend from Google Ads. Pull MQLs from HubSpot. Pull pipeline from Salesforce. Cross-reference with GA4 sessions. Rewrite last week's narrative with this week's numbers. By Tuesday afternoon, the deck is ready. By Wednesday, half the numbers have moved.
The problem isn't that the work is hard — it's that it's mechanical. The interesting analysis (why did demo-request rate spike on Friday?) gets crowded out by the assembly work (download-paste-format-repeat).
Two structural issues compound this:
- Cross-channel attribution is messy. A lead that touches Google Ads, then organic, then a webinar, then sales, looks like four leads if you don't stitch identities. Most teams give up and use last-touch.
- Significance vs noise. Most week-over-week deltas are statistical noise. Without a rigorous test for "is this real?", every deck reads like everything moved.
⚠ Numbers below use synthetic data; real deployments are confidential.
The DataCraves Approach
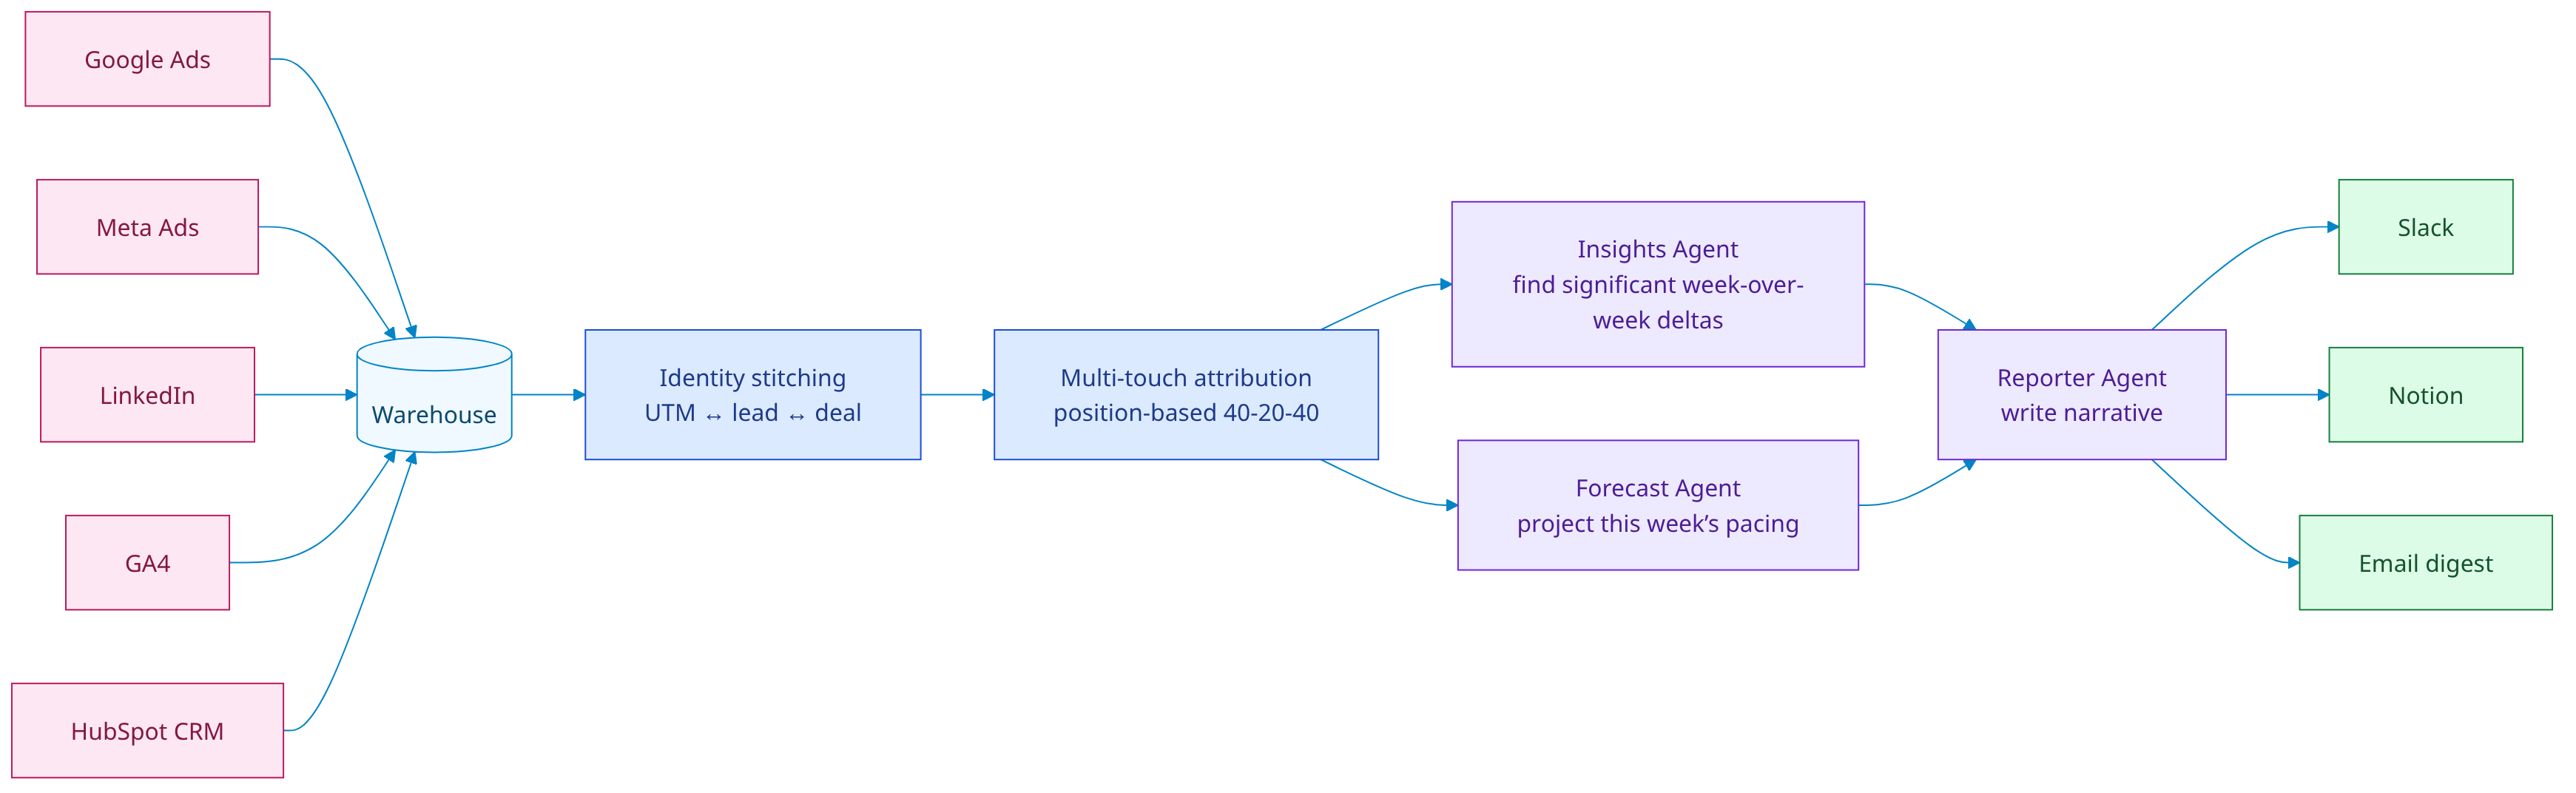
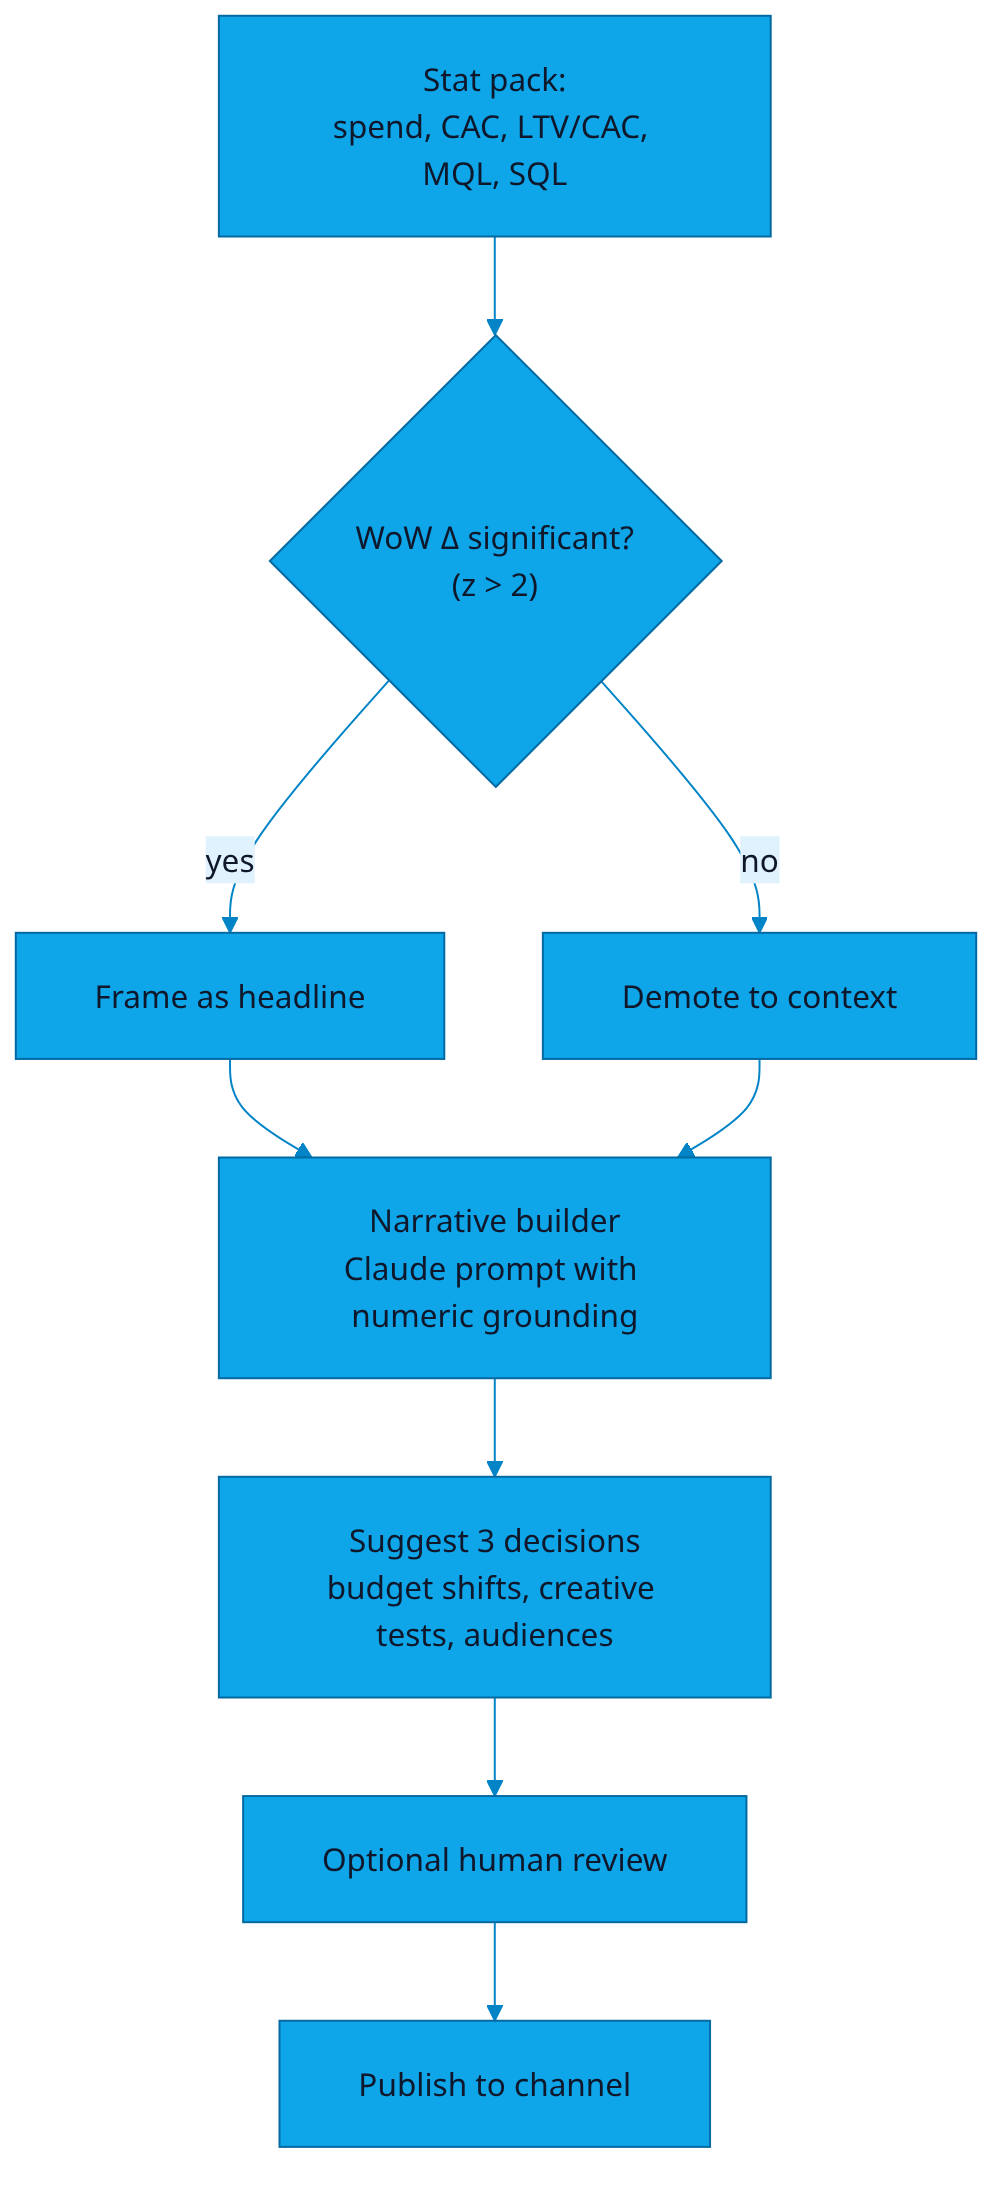
Reporter Agent reads from your ad platforms, your CRM, and your product analytics. Insights Agent identifies the deltas that pass a significance test (z > 2 vs 8-week baseline). Forecast Agent projects the rest of the week's pacing. Reporter writes a one-page narrative in your team's tone of voice, drops it in Slack at 9:00 Monday, with the three decisions you should make this week.
Identity stitching
We unify users across UTM clicks, form fills, anonymous sessions, and CRM records using a probabilistic match (email hash, IP+UA, session continuation). The stitched identity becomes the unit of attribution.
Attribution model
Default is position-based 40-20-40 (first touch + middle touches + last touch), configurable. We never ship pure last-touch — it systematically underweights brand and discovery channels.
The Architecture
The Dashboard
The Math / The Logic
Significance test. Before any number gets framed as a "headline" in the narrative, we test it against an 8-week rolling baseline:
def is_significant(this_week, baseline_8w):
    mu = np.mean(baseline_8w)
    sigma = np.std(baseline_8w, ddof=1)
    z = (this_week - mu) / max(sigma, 1e-6)
    return abs(z) > 2, z   # roughly p < 0.05 two-sided
Position-based attribution. For a lead with touch sequence t_1, t_2, ..., t_n:
def attribute(touches, weights=(0.4, 0.2, 0.4)):
    n = len(touches)
    if n == 1: return {touches[0]: 1.0}
    if n == 2: return {touches[0]: 0.5, touches[1]: 0.5}
    first, last, mids = touches[0], touches[-1], touches[1:-1]
    out = {first: weights[0], last: weights[2]}
    for m in mids:
        out[m] = out.get(m, 0) + weights[1] / len(mids)
    return out
Narrative grounding. The Reporter Agent uses an LLM but is constrained to "numeric grounding": every claim in the narrative must reference a metric tuple (name, value, baseline, z-score). The prompt enforces "if you can't ground it, drop it".
Sample Output / Insight
Weekly marketing brief — Week 19 (mock data)
Spend held flat at ₹18.4 L (+4.2%). MQLs up 11.8% to 412 — the biggest week-over-week jump since W14. Three things actually moved:
- 1. LinkedIn ABM campaign hit its stride. CAC dropped 22% on the enterprise audience after the new "ROI calculator" creative went live Tuesday.
- 2. Meta efficiency degraded again. Now 60% above blended CAC. Z-score = +2.4 vs 8-week baseline. Recommend pausing the lookalike-3% audience this week.
- 3. Webinar funnel surprised. Thursday's "AI agents in fraud" session pulled 412 registrations vs 180 forecast.
Decisions for this week:
- ↗ Shift ₹3 L from Meta lookalike to LinkedIn ABM.
- ↗ Replicate the webinar topic in a follow-up nurture sequence.
- ↘ Pause the GDN display campaign — CTR is 0.04% and pulling 0 SQLs.
ROI Math
- Time saved. 1 marketing analyst × 6 hours/week × ₹2,500/hr = ₹15K/week = ~₹7.8 L / yr saved per analyst.
- Spend efficiency. Significance-tested decisions move 8-12% of weekly spend from low-ROI channels to high-ROI ones. On ₹1 Cr/mo spend, ~₹10 L/mo reallocated → ~10-15% MQL uplift = 40-60 extra MQLs / mo at the same spend.
- Speed-to-decision. Decisions made Monday 9am instead of Wednesday 5pm = 2.5 days faster reaction to bad campaigns.
- Total annualised. ~₹15-20 L / yr in time + spend efficiency gains for a typical 4-channel mid-market team. DataCraves Pro at ₹60K / yr → 25-30× return.
Assumption to challenge: the 8-12% reallocation only works if leadership trusts the agent enough to actually act on the recommendations. Week-1 trust is usually low; ROI ramps over 6-8 weeks.
Common Pitfalls
Based on observed time-to-report for 3-channel mid-market teams; doesn't account for training time in week 1.
Run this on your own data?
A 30-minute demo shows the agents working against your warehouse — not a pre-baked sandbox.
Book a demo →Mock data, real patterns. Every visualization is synthetic to preserve client confidentiality.