
Detect transaction anomalies before they become fraud cases
Rule-based fraud systems miss novel attack patterns and drown your ops team in false positives. Tuning them is a full-time job and the fraudsters always move first.
The Problem
Rule-based fraud systems work brilliantly for the attack patterns you've already seen — and miss every novel one. They drown the ops team in false positives and cost a fraud analyst's full week to tune. Meanwhile, the fraudsters iterate weekly: new device fingerprints, new mule networks, new card-testing flows.
Three concrete failure modes show up in nearly every fintech we talk to:
- The new-pattern blind spot. A novel attack — say, account-takeover via a leaked OAuth refresh token — slips through every existing rule for the first 11–14 days while the team is still writing a rule for it.
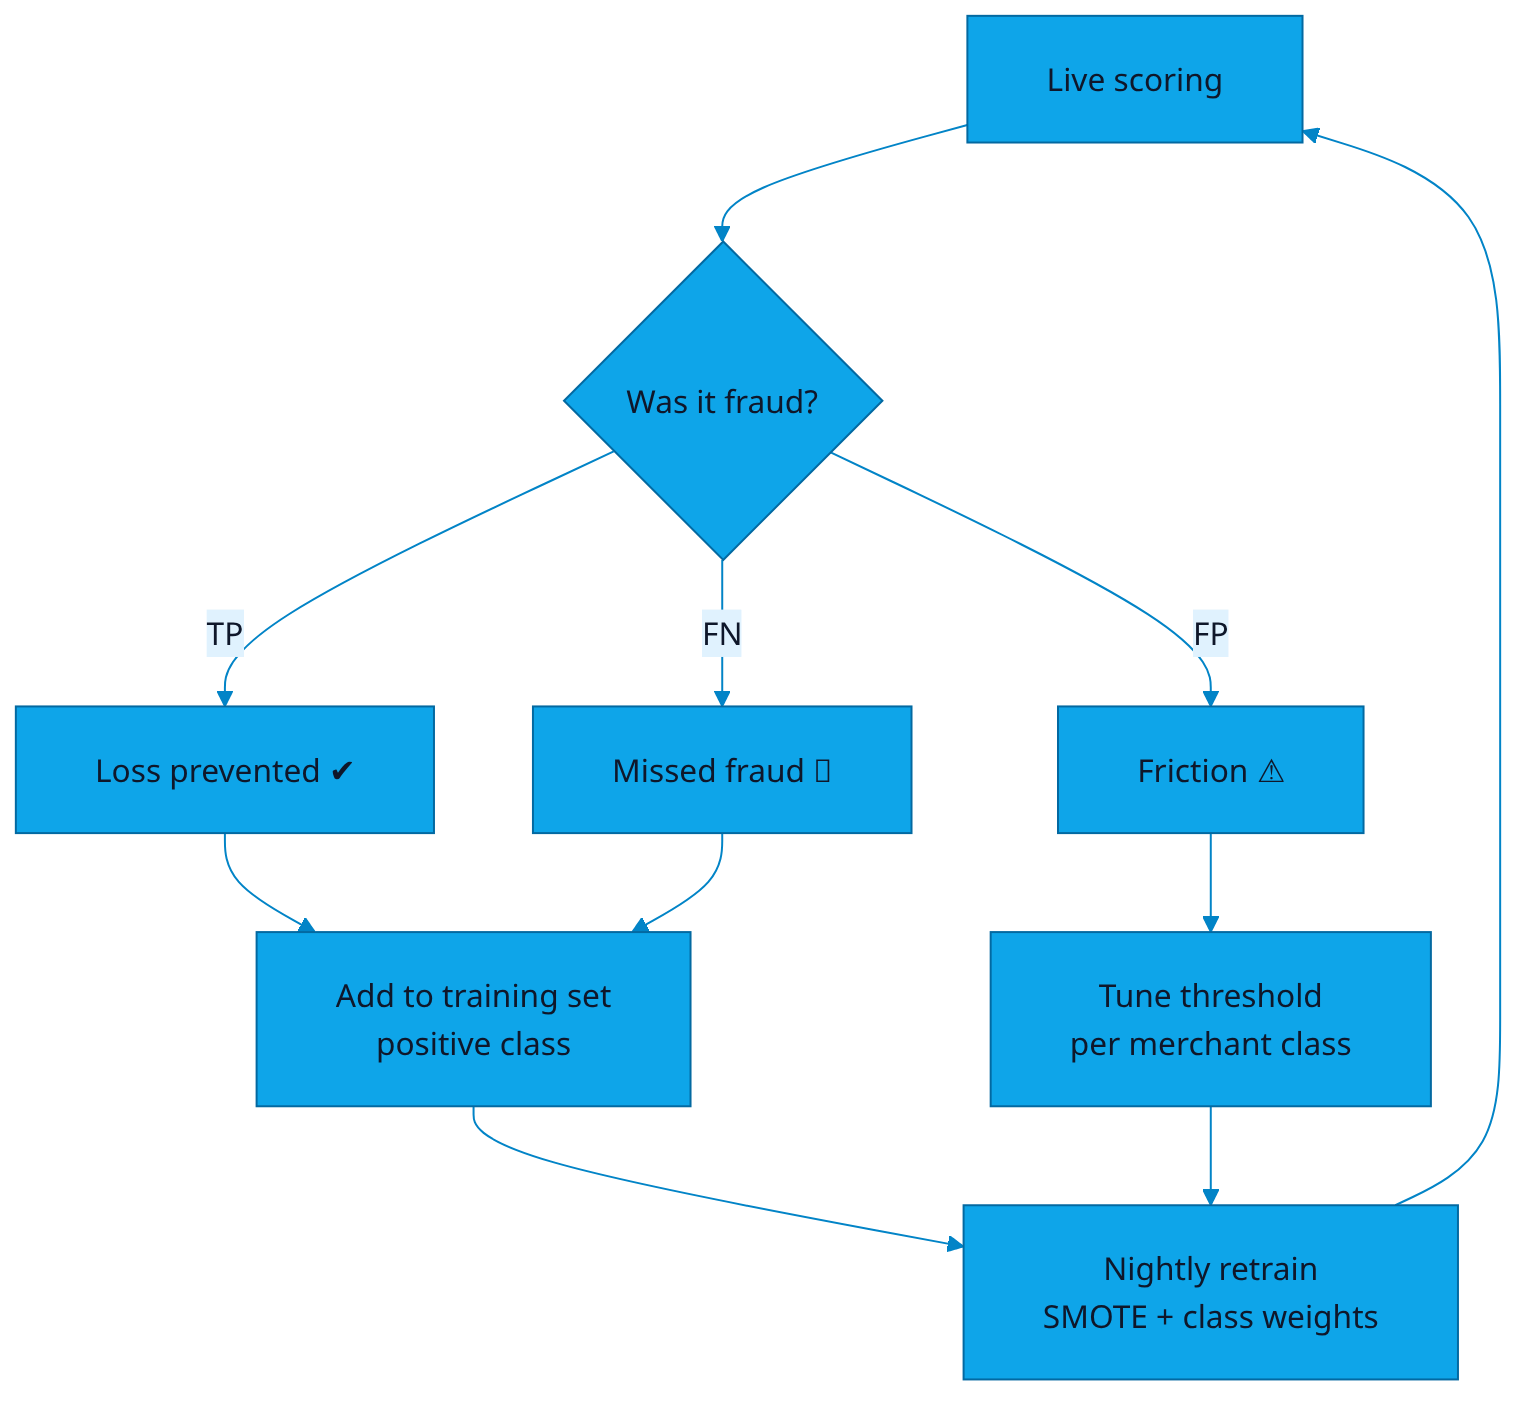
- False-positive fatigue. The ops team reviews 4,000 holds a day. Genuine fraud sits in the same queue as a tourist trying to buy chai at the airport. Reviewer judgement degrades after 200 cases.
- The threshold tradeoff. Tighten thresholds to catch more fraud, false positives explode and customers complain. Loosen them, fraud losses jump. There's no good operating point.
⚠ All transaction examples below use synthetic data.
The DataCraves Approach
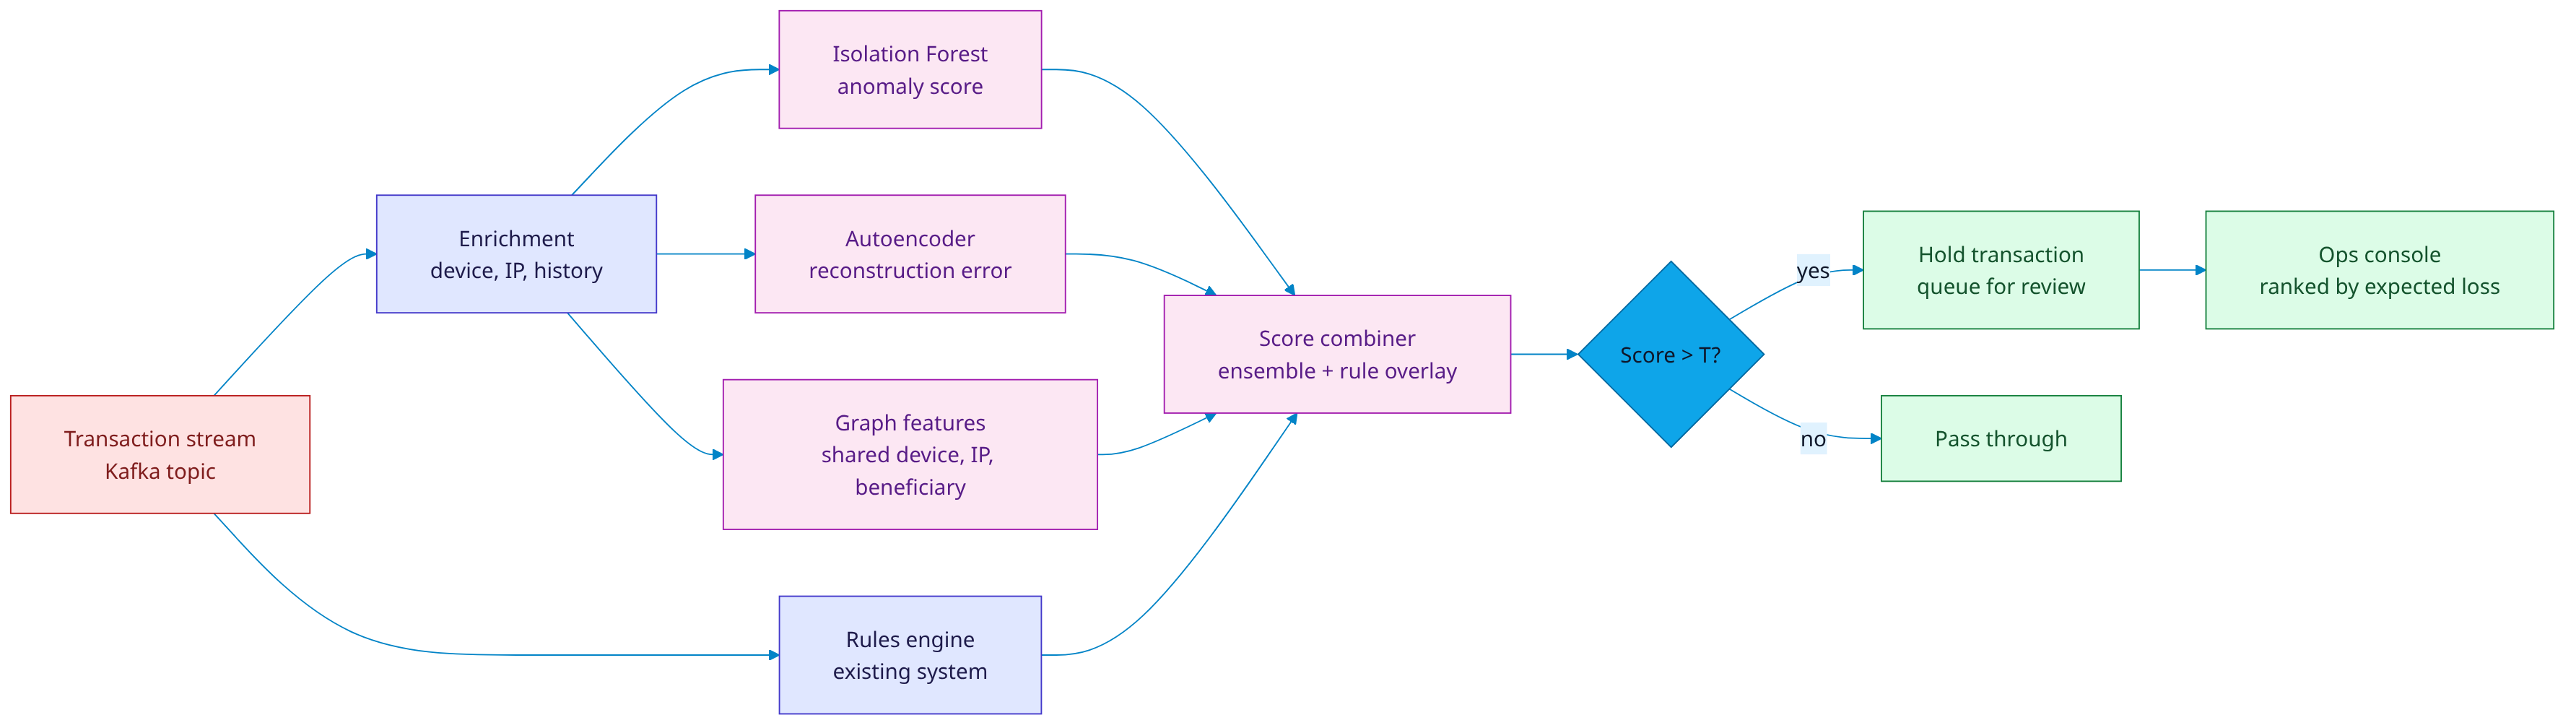
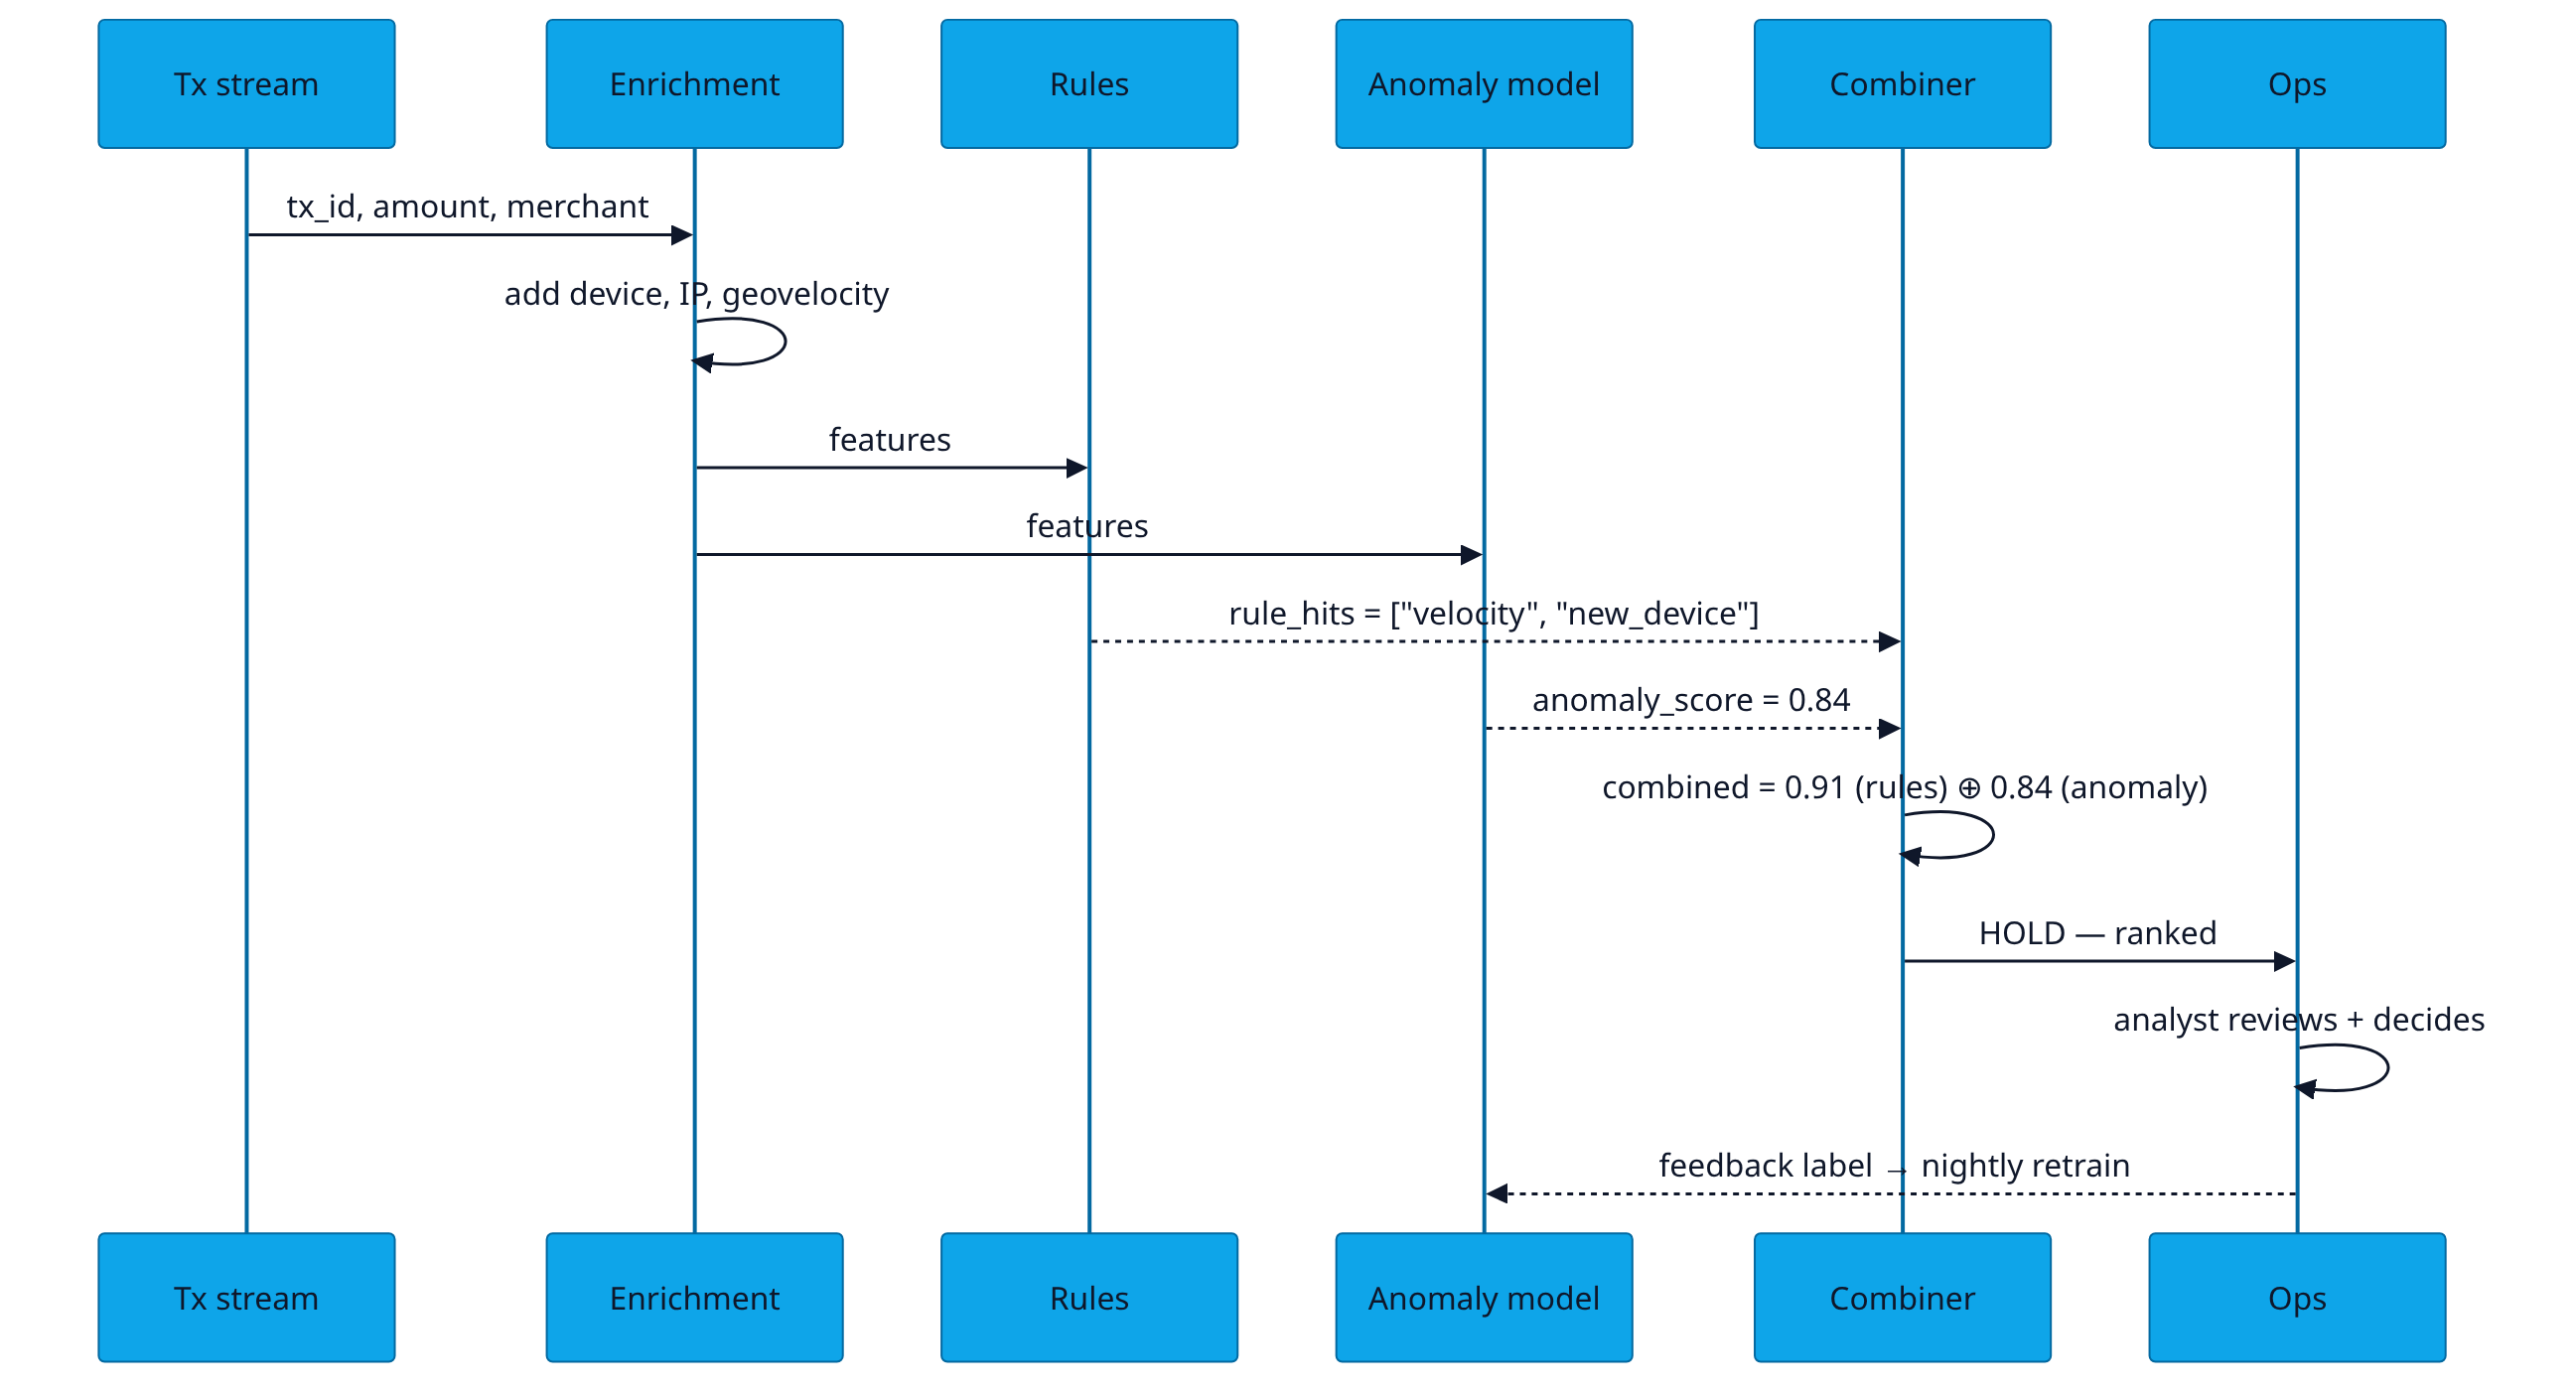
We don't replace your rules engine. We layer an unsupervised anomaly model on top of it, then a graph-feature scorer that catches mule networks the rules can't see. The combiner blends rule signals and ML signals into a single ranked queue, sorted by expected loss, not raw score.
Three signals, one decision
- Isolation Forest on transaction-level features — amount, merchant category, geo-velocity, time-of-day, device entropy. Flags transactions that don't look like the user's history.
- Autoencoder on the user's last-30-day behavioural embedding. Reconstruction error spikes when behaviour suddenly changes (compromised account).
- Graph features — shared device fingerprints, IP clusters, beneficiary networks. Catches mule rings that look fine transaction-by-transaction.
The combiner uses a Bayesian update: rule signals form the prior, ML signals form the likelihood, the posterior is the ranked score. Each signal carries its own confidence, so a high-confidence rule still wins over a low-confidence ML flag.
The Architecture
The Dashboard
The Math / The Logic
Each of the three ML scorers produces a value in [0, 1]. The combiner uses a calibrated logistic blend:
# combiner.py
import numpy as np

def combine(rule_score, iso_score, ae_score, graph_score,
            weights=(0.35, 0.25, 0.20, 0.20)):
    # Logistic blend, calibrated on a held-out validation week.
    z = sum(w * np.log(s / (1 - s) + 1e-9)
            for w, s in zip(weights,
                              [rule_score, iso_score, ae_score, graph_score]))
    return 1 / (1 + np.exp(-z))

def expected_loss(score, amount, recovery_rate=0.18):
    # Rank by E[loss], not by score, so high-value low-prob fraud wins.
    p_fraud = score
    return p_fraud * amount * (1 - recovery_rate)
Geo-velocity feature. A classic but still useful signal:
def geo_velocity_kmh(t1_loc, t1_time, t2_loc, t2_time):
    dist = haversine_km(t1_loc, t2_loc)
    hours = (t2_time - t1_time).total_seconds() / 3600
    return dist / max(hours, 0.0001)
# > 800 km/h → impossible without a flight, contributes +0.4 to anomaly score
Graph-feature signal. Build a bipartite graph of (user, device) edges over a 90-day window. For each new transaction, compute the connected-component size containing the user. Components > 14 with > 3 chargebacks in history get a +0.3 graph_score boost.
Sample Output / Insight
HOLD — txn_id 0x3F2A1C · score 0.91 · expected loss ₹4,200 · rank #3 today
User u_881271 initiated ₹4,200 transfer to a beneficiary added 11 minutes ago. Three signals fired simultaneously:
- • Anomaly: amount is 4.2× user's 90-day median (z = +3.1)
- • Behavioural: autoencoder reconstruction error 8.7 (baseline 1.2)
- • Graph: beneficiary shares device fingerprint with 3 chargeback accounts
Suggested action: hold for step-up auth (OTP + selfie). 78% of similar holds last quarter were confirmed fraud.
ROI Math
- Baseline. Mid-size payments business, ₹2,000 Cr / yr GMV, fraud loss rate 14 bps → ₹2.8 Cr / yr in fraud losses, FP rate 2.9% (~58K customer complaints / yr).
- Catch-rate lift. 1.8× catch at same FP budget → loss rate drops from 14 bps to 7.7 bps → ₹1.26 Cr / yr saved.
- FP reduction. 2.9% → 1.7% → 24,000 fewer customer-complaint cases / yr → ~₹35 L saved in support cost + customer churn avoidance.
- Analyst time. 38s vs 60s median review → 36% throughput gain → 2.2 FTEs equivalent freed (~₹40 L / yr).
- Total annualised. ~₹2.0 Cr / yr saved vs DataCraves Enterprise tier ≈ net ROI 25-30×.
Assumptions to challenge: 1.8× catch is an apples-to-apples ML uplift over a mature rules engine. If your rules engine is <6 months old, expect 2.5–3× lift. If it's been hand-tuned for years, expect closer to 1.4×.
Common Pitfalls
Honest framing: pilot benchmarks against rule-only systems; effect size depends on how mature your existing rules are.
Run this on your own data?
A 30-minute demo shows the agents working against your warehouse — not a pre-baked sandbox.
Book a demo →Mock data, real patterns. Every visualization is synthetic to preserve client confidentiality.